
Restaurant Menu Pricing Methods: Formulas, Strategies and Discounts That Protect Your Margin
Food cost percentage, markup, margin and contribution margin explained with euro examples — plus cost-based, market-based and value-based pricing, menu engineering, menu psychology, break-even maths for discounts and the EU rules on showing menu prices.
What Menu Pricing Methods Are and Why They Matter More Since 2022
A guest on a harbour terrace sees a price next to the risotto. They never see the calculation behind it: what the plate costs to produce, what similar venues nearby charge, and what diners believe the dish is worth.
Menu pricing methods are different ways of weighing those three inputs. Some start from cost and add a margin, often set as a target food cost percentage. Others start from the market. Value-based pricing charges for the experience a dish delivers, not the ingredients.
For years many operators raised prices once a year, by habit. The inflation wave of 2022 broke that routine. According to Eurostat, annual HICP (Harmonised Index of Consumer Prices) inflation in the EU peaked at 9.2% in 2022 and had eased to 2.5% by 2025. Slower inflation did not mean lower prices. Costs settled higher and stayed.
Eurostat data show EU food and non-alcoholic beverage prices rose 33.2% between 2016 and 2025, the steepest increase of any HICP main heading. Restaurant and accommodation services prices, a simple indicator of HICP restaurants and cafés inflation, rose 28.3%. So the kitchen got more expensive faster than the table. For many venues, that difference made their margin smaller.
9.2%
EU annual HICP inflation at its 2022 peak
Eurostat
2.5%
EU annual HICP inflation in 2025
Eurostat
33.2%
Rise in EU food and non-alcoholic beverage prices, 2016–2025
Eurostat
28.3%
Rise in EU restaurant and accommodation services prices, 2016–2025
Eurostat
That gap is why method matters. Prices you set on purpose and review often absorb cost swings. If you price by instinct, you only see the problem at the end of the month.
This article covers the formulas, main methods, menu psychology, discounts and EU price rules. We’d start with one simple step: this week, check your five best-sellers against today’s ingredient costs.
The Core Formulas: Food Cost Percentage, Markup and Gross Margin
Ask three owners how much a dish “makes” and you may get three answers. Every pricing method here comes down to four simple calculations. The trouble starts when owners mix them up, or skip recipe costing (working out what each plate costs).
Food Cost Percentage per Dish
Weigh every ingredient in one portion and price it at what you paid your supplier. The total is the plate cost. As the Escoffier culinary school explains, the food cost percentage is that ingredient cost divided by the menu price, multiplied by 100.
Illustrative example: a risotto with a plate cost of €4.20 sells for €14. Its food cost percentage is 4.20 ÷ 14 × 100 = 30%. Industry guides often quote 28–35% as the typical range. Escoffier notes that many establishments aim for 30% or less. Treat those figures as rules of thumb, not benchmarks.
Here’s the thing: the figure is only as reliable as your portion control. If the kitchen plates 180 g of rice when the recipe card says 150 g, the real food cost is higher than the one on paper.
Food Cost Percentage for the Whole Menu
Per-dish figures show what should happen. Inventory-based food cost shows what did happen, including waste and over-portioning. Escoffier gives the formula as (opening inventory + purchases − closing inventory) ÷ food sales × 100.
Illustrative example: a café opens the month with €8,000 of stock. It buys €22,000 and closes with €7,000 on the shelves. It used €23,000 of food against €70,000 in food sales. Its food cost is 23,000 ÷ 70,000 × 100 ≈ 32.9%. If its recipe cards average 30%, almost three points are lost between delivery and the plate.
Markup vs Margin: The Difference Many Owners Mix Up
Markup measures profit against cost. Gross profit margin measures it against the selling price: (selling price − cost of goods sold) ÷ selling price × 100. Same euros, very different percentages.
| Metric | Formula | Risotto: plate cost €4.20, price €14 |
|---|---|---|
| Food cost percentage | cost ÷ price × 100 | 30% |
| Markup | (price − cost) ÷ cost × 100 | 233% |
| Gross profit margin | (price − cost) ÷ price × 100 | 70% |
| Contribution margin | price − cost | €9.80 |
An owner who says “I want a 70% markup” but means a 70% margin will underprice badly. A 70% markup on €4.20 gives €7.14, half of €14.
Gross profit is not what you keep. Net profit is gross profit minus labour and operating costs such as rent and energy.
Contribution Margin: The Number Menu Engineering Runs On
Contribution margin is simply the euros a dish leaves you after food cost: menu price minus food cost per dish. Each sale adds this toward wages, rent and profit.
Illustrative example: a pasta dish costs €3 to make and sells for €12. That is a 25% food cost and a €9 contribution. A steak costs €11 and sells for €28. Its food cost is 39.3%, which looks worse. Yet every steak brings in €17. That’s why menu engineering ranks dishes by contribution margin.
We suggest you track both numbers for every dish. Use food cost percentage to find kitchen problems. Use contribution margin to decide which dishes to promote.
Cost-Based Methods: Cost-Plus and Target Food Cost Pricing
Before anyone talks about price, someone has to know what a plate costs. So most operators start there. There are two common ways to do it.
With cost-plus pricing, you apply a fixed markup to the ingredient cost. Illustrative example: €5 of food cost with a 300% markup gives a €20 menu price, because the price is four times the cost. Target food cost pricing works the other way round. You divide the raw cost by the share of the price the food should take. Illustrative example: a €4 dish at a 28% target sells for about €14.29 (4 ÷ 0.28). Pricing guides often put a healthy food cost percentage at roughly 28–35% of the menu price. Treat that as a starting range, not a benchmark.
Worked Example: Pricing a Pasta Dish in Euros
Illustrative example. A trattoria calculates the cost of its tagliatelle al ragù:
| Ingredient | Cost per portion |
|---|---|
| Fresh pasta, 120 g | €0.90 |
| Ragù, 150 g | €2.20 |
| Parmigiano, 15 g | €0.50 |
| Oil, butter, herbs | €0.30 |
| Total plate cost | €3.90 |
At a 30% target, the price is €3.90 ÷ 0.30 = €13.00. Cost-plus at a 250% markup gives €3.90 × 3.5 = €13.65. Both only work with strict portion control. Serve 180 g of ragù instead of 150 g, and the cost rises while the price doesn’t.
Typical scenario
A supplier raises the price of beef, and the plate cost rises from €3.90 to €4.40. At €13.00, food cost jumps to 33.8% (€4.40 ÷ €13.00). Getting back to 30% would mean a €14.67 price (€4.40 ÷ 0.30). Kitchens that don’t recost regularly usually notice supplier price changes like this only when the monthly figures come in.
The Limits of Cost-Based Pricing
A formula based only on ingredients leaves out most of what it costs to run a restaurant. A 30% food cost says nothing about overhead and labour cost. A slow-cooked stew that takes a cook’s whole afternoon can hit its target and still lose money.
Cost-based methods also ignore the guest. They can’t tell you if €13.65 is cheap or expensive for your street, or if the dish sells at all.
Here’s our advice: use cost-based pricing as your floor, not your final price. Recost your best-sellers whenever a supplier invoice changes. Market-based methods answer the rest.
Market-Based Methods: Competitive, Value-Based, Premium and Demand-Driven Pricing
A cost-based price tells you the lowest figure you can charge. It says nothing about what the guest will pay. Market-based methods start from the street, the competition and the moment of purchase.
Competitive Pricing
Competitive pricing means setting your prices against similar venues nearby, then placing yourself slightly below, level with or above them. Photograph five nearby menus and note what a margherita and a flat white cost.
Illustrative example: if most neighbours charge €12–14 for a pizza, a €19 margherita needs a visible reason. The danger is copying numbers without checking your own costs. A competitor with cheaper rent can survive on margins that would not cover your costs.
Value-Based and Premium Pricing
Value-based pricing sets the price by perceived value: what the dish is worth to the guest, not what it costs you. Where the ingredients come from, a signature technique or a sea-view terrace all raise it.
Premium pricing places a venue or dish at the top of the local price range on purpose. The higher price itself signals quality.
Illustrative example: a slow-cooked beef cheek costs €5.40 in ingredients. At a 30% food cost target, it would sell at €18 (5.40 ÷ 0.30). Local competitors charge €22 for similar slow-cooked dishes. Guests rate it as a signature dish, so the owner prices it at €24. Food cost drops to 22.5% (5.40 ÷ 24). Each plate now earns €18.60 in contribution margin (24 − 5.40) instead of €12.60 (18 − 5.40). Same dish, €6 more.
Demand-Driven and Time-Based Pricing
Demand-driven pricing links the price to how much people need you at that moment. It is most common in airports, stadiums and other places where guests have few options.
In ordinary town-centre venues, the softer version is time-based pricing: a lunch set menu or a weekend brunch price. Dynamic pricing, where prices change automatically with demand, is getting more attention. One widely quoted industry survey suggests roughly six in ten adults are open to it, with younger guests more open than older ones. It also suggests around a third of operators plan to invest in it. Treat these as rough indications, not settled figures.
Launch Pricing for New Dishes
A new dish or venue needs one of two strategies. Price skimming starts high to attract curious early guests, then lowers the price. Penetration pricing starts low to get people to try it and build regulars, then rises.
Price skimming
- Starts high, lowers later
- Suits novelty or limited-run dishes
- Protects margin from day one
- Risk: slow early uptake
Penetration pricing
- Starts low, rises later
- Suits everyday staples and new venues
- Builds volume and repeat visits first
- Risk: guests resist the later increase
We’d skim for a seasonal special. For a long-term dish, keep the launch discount small so regulars accept the later increase.
Market prices tell you what guests will accept. Menu engineering shows which dishes earn the most.
Menu Engineering: Pricing by Contribution Margin and Popularity
Illustrative example: a €10 burger with €3 of food cost (30%) looks better than a €24 duck breast with €9 of food cost (37.5%). Then count the euros each plate leaves behind: €7 for the burger and €15 for the duck. Food cost percentage cannot tell you which dishes actually pay the rent.
That shift is the core of menu engineering. Michael L. Kasavana and Donald I. Smith introduced the method in 1982. It judges every dish on two axes: how often it sells and how much contribution margin it earns.
Sales counts come from your POS data, costs from your recipe cards. Compare each dish with the menu average on both. This simplifies the original method, but it is enough to start.
Illustrative example
| Dish | Price | Food cost | Contribution margin | Sold (4 weeks) | Quadrant |
|---|---|---|---|---|---|
| Grilled sea bass | €26.00 | €9.50 | €16.50 | 80 | Star |
| Margherita pizza | €12.00 | €3.00 | €9.00 | 140 | Plowhorse |
| Braised lamb shank | €28.00 | €10.00 | €18.00 | 30 | Puzzle |
| Vegetable tart | €14.00 | €6.50 | €7.50 | 25 | Dog |
Here the average contribution margin is €12.75 and average sales are 68.75 portions. A dish’s position against those two lines decides your pricing move.
The Four Quadrants and the Pricing Move for Each
- Stars are popular and profitable, like the sea bass. They can usually take a small price rise, because demand is already proven.
- Plowhorses sell well but earn little per plate. Instead of a sharp increase, trim costly garnishes, adjust the portion or move up by €0.50 at a time.
- Puzzles earn well but sell slowly. Rename them, rewrite the description or ask staff to recommend them. Or test a slightly lower price to find out whether price is what holds them back.
- Dogs are candidates for removal. Keep one only if it serves a clear purpose, such as the only vegan main on the menu.
What the Evidence Says About Menu ‘Sweet Spots’
Many guides advise placing Stars and Puzzles in the “golden triangle”, where the eye supposedly lands first. But according to Wikipedia’s summary of the research, there is little real evidence that these sweet spots work.
We suggest treating layout as an idea to test against your own sales figures, not as a sure way to raise sales. Move one Puzzle, change nothing else, and compare its sales before and after.
Menu Psychology: Currency Symbols, Charm Prices, Anchors and Decoys
Once the numbers work, look at how prices sit on the page. Psychological pricing covers small presentation choices (symbols, endings, placement) that change how expensive a dish feels.
Dropping the Euro Sign
The most cited evidence comes from a Cornell University and Culinary Institute of America study of 201 diners. Guests ordering from a menu without currency symbols spent about 8% more on average, or $5.55, than guests whose menu showed prices with a dollar sign. Sheryl Kimes of Cornell, one of the researchers, links this to the “pain of paying”.
Prices written out in words (“twenty-four”) did no better than numerals with a symbol. So currency symbol omission works best as plain figures: “24” rather than “€24.00” or “twenty-four euros”. Whichever format you choose, the figure must still be the final price the guest pays (see the EU rules below).
Charm Prices vs Round Prices
Charm pricing uses endings such as .99 or .95 so a price reads lower. Guests see €12.95 as “twelve-something”, not “thirteen”. It suits cafés, takeaway counters and value-led menus, where guests compare prices. Upscale restaurants and hotel dining rooms usually prefer round numbers like €28, which signal confidence, not a bargain.
In our view, consistency matters more than the style itself: pick one and stay with it. A menu that mixes €9.95, €14 and €17.50 looks improvised.
Anchors and Decoys
Anchor pricing puts a high-priced item, such as a sharing platter or a premium steak, near the top of a category so that everything below looks reasonable. Decoy pricing goes a step further. With a low and a high anchor on either side, the mid-priced option looks like the sensible choice.
Combine this with menu engineering. The decoy should sit next to the dish with the best contribution margin, not next to a random one.
“The dish you most want to sell rarely needs to be the most expensive one; it needs to sit next to it.”
Illustrative example: a wine bar lists three reds by the glass at €6, €9 and €16 (VAT ignored for simplicity). The €16 glass rarely sells, but it makes €9 look moderate. The €9 wine costs €2.70 per glass, a 30% cost, leaving €6.30. The €6 glass costs €2.40, a 40% cost, leaving €3.60. The difference is €2.70 per glass. Say the anchor moves ten orders a night from the cheapest glass to the middle one. Total contribution margin rises by €27 a night (10 × €2.70), without a single price change.
Start with one category: find its best-margin dish and place a higher-priced option next to it.
Discounts and Promotional Pricing Without Eroding Margin
It’s a slow Tuesday and half your tables are empty. A promotion can fill them, but it can also quietly give away your margin. Discounts work when you know in advance how many extra covers the offer must bring in.
Types of Restaurant Promotions: Happy Hour, Bundles, Set Menus, LTOs
A happy hour lowers drink or snack prices in a fixed window, usually the quiet hours before dinner. Bundle pricing puts several items together for less than they would cost separately, like a burger with fries and a drink. A set menu is a bundle with courses, often used at lunch. A limited-time offer (LTO) puts a seasonal dish or a reduced price on the menu for a set period.
Bundles and set menus tend to protect margin better than flat discounts. You can pair a high-margin item, such as a soft drink or a dessert, with one whose margin is lower.
How to Calculate the Break-Even Uplift for a Discount
The number to protect is contribution margin, and a discount comes straight out of it. So how much more do you have to sell to earn the same total?
Illustrative example; prices net of VAT.
- Work out the current contribution margin: €12.00 price − €3.60 food cost = €8.40.
- Apply the discount: a 20% cut brings the price to €9.60, so the new margin is €9.60 − €3.60 = €6.00.
- Divide the old margin by the new one: €8.40 ÷ €6.00 = 1.4.
- Read the result: you need 40% more sales of that dish just to break even (for example, 70 portions a week instead of 50).
That’s a lot of extra plates. The lower a dish’s food cost percentage, the smaller the uplift it needs, so strong-margin dishes are safer to promote.
Applying Dish-Level Discounts on a Digital Menu
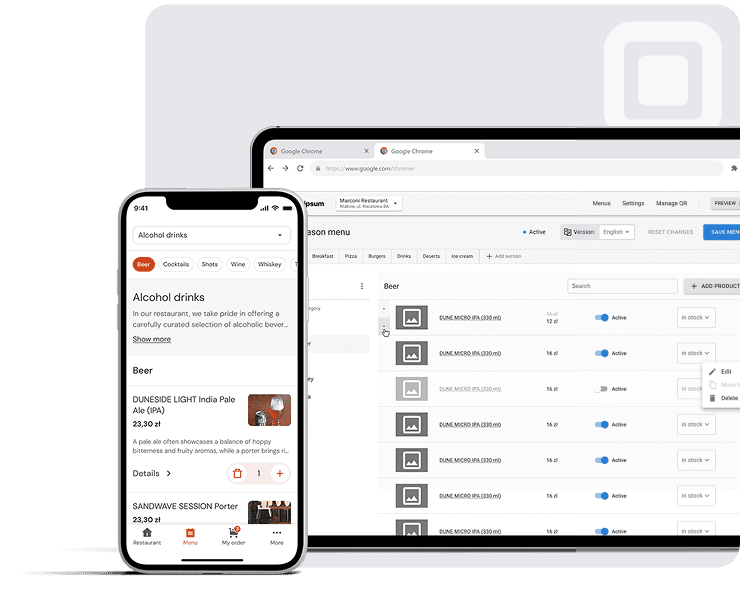
On a printed menu, a promotion means reprinting or clipping a card to it. In a QR menu such as Platoo, you can apply a discount to an individual dish, and guests see the reduced price next to it. You can also change prices across the menu in a few clicks. Illustrative example: you discount two starters for a weekday happy hour and restore the usual prices afterwards. Guests see the update straight away, with nothing to reprint.
Announcing a ‘Was/Now’ Price: What the 30-Day Rule Covers
If you show a crossed-out “was” price, EU law may decide what that number can be. Since the Omnibus Directive, an announced reduction on goods has to be measured against the lowest price of the previous 30 days. It cannot be measured against the highest price you ever charged.
Does that cover a plated dish or a happy hour? The answer is less simple than many owners think. Before you post a “was/now” price, check your 30-day low. The next section explains where the rule applies and where it does not.
EU Rules for Showing Menu Prices
Every method so far ends as a number on a menu. EU consumer law cares less about what you charge than whether a guest can trust it.
Clear, Final Prices and National Rules on Cover and Service Charges
According to the European Commission, the Price Indication Directive 98/6/EC requires prices to be unambiguous, easily identifiable and clearly legible. But that Directive covers products (goods), not services, so it is not the main rule behind menu prices. For restaurants, the duty to show the final price comes from the Unfair Commercial Practices Directive 2005/29/EC. When you invite a guest to buy, Article 7(4)(c) treats the price including taxes as key information. National price display rules add to this, and they often apply to restaurants directly. Examples are rules on showing the menu at the entrance and on cover charges (a fixed per-guest fee for bread and table setting) and service charges. In practice, the menu figure should be the VAT-inclusive amount the guest pays.
Cover charges, bread fees and automatic service percentages follow national rules, so a line that is normal in one Member State can count as misleading in another. We suggest checking local rules before you bill anything the menu does not show.
Discounts have their own rule. The Omnibus Directive 2019/2161 added Article 6a to Directive 98/6/EC. Under this 30-day rule, a price reduction announcement must refer to the lowest price applied in a period of at least 30 days before the reduction.
On 26 September 2024, the Court of Justice of the EU added a further point. The advertised reduction itself, such as “−20%”, must be calculated from that lowest 30-day price.
The European Commission’s guidance limits the scope:
- It covers goods, not services.
- Member States may set different rules for goods that spoil or expire quickly (Article 6a(3)).
- It does not apply to loyalty programmes or genuinely personalised reductions.
- In a campaign where the discount grows step by step, the reference stays the price before the first cut.
Is a plated meal a service? Ask for local advice.
Illustrative example: a bistro normally lists a burger at €16.00. For one week within the last 30 days, it sold the burger at €15.00. Where the rule applies, a promotion at €14.00 should be shown against €15.00. That is a €1.00 saving, not a €2.00 saving against €16.00.
| Rule | Source | What it means for the menu |
|---|---|---|
| Final price incl. taxes | Directive 2005/29/EC, Art. 7(4)(c) + national rules | One VAT-inclusive figure per item |
| Prior price on reductions | Article 6a, added by Directive 2019/2161 | Quote the lowest price of the previous 30 days |
| Allergen information | Regulation (EU) 1169/2011 | Allergens available for every dish |
Allergen Information Next to the Price
Since 13 December 2014, Regulation (EU) 1169/2011 has required allergen information for non-prepacked food. The European Commission confirms this includes restaurant dishes. Annex II lists the substances concerned. In the industry, people usually call them the 14 major allergens.
Say you swap an ingredient to protect the margin on a dish. The allergen line has to change with the recipe. Our tip: treat every recipe change as two updates, price and allergens.
Pricing for Tourist Locations and Hotel F&B (Food and Beverage), and How Often to Reprice
Picture a harbour terrace or a hotel lobby bar. According to UN Tourism, Europe received 793 million international arrivals in 2025, up 4% and 6% above 2019, out of 1.52 billion worldwide. For these venues, guests change weekly and rarely compare you with the place across town.
793 million
International arrivals in Europe, 2025
UN Tourism
40%
Consumers who will never buy from websites in other languages
CSA Research
76%
Consumers who prefer information in their own language
CSA Research
Seasonal and Tourist-Demand Pricing
Here value-based pricing usually beats pure cost-plus. The sea view or late kitchen is part of what the guest pays for. Seasonal menu pricing is a simpler, planned alternative to dynamic pricing. You set high- and low-season price lists in advance. In both seasons, treat food cost percentage as a ceiling.
Language matters too. CSA Research’s 2020 survey of 8,709 consumers in 29 countries found 76% prefer buying with information in their own language. And 40% will never buy from websites in other languages. If a guest cannot read a price in context, it is hard to judge it as fair.
A Quarterly Price Review Routine
The Eurostat figures above show that costs do not wait for your annual reprint. Here’s our advice: each quarter, recost your dishes from current invoices. Flag the ones above your target food cost. Then compare your average increase with the latest HICP restaurants and cafés inflation figure.
Illustrative example: a dish costs €4.20 and sells at €14. That is a 30% food cost (4.20 ÷ 14 = 0.30). Now ingredients rise to €4.90. Food cost reaches 35% (4.90 ÷ 14 = 0.35). To get back to 30%, you need €16.33 (4.90 ÷ 0.30). On the menu, that becomes €16.50.
With a digital menu such as Platoo, you enter the new prices in a few clicks. They appear straight away in every language version of the menu, with no reprint.
Related reading
FAQ: Restaurant Menu Pricing
A common industry rule of thumb puts food cost percentage at roughly 28–35% of the menu price. It is a starting point, not a fixed target. A steakhouse with expensive proteins may run higher, a pizzeria or coffee bar lower. What matters is enough cash margin for labour, rent and profit.
Divide the plate cost by your target food cost percentage. Plate cost includes garnish and a waste allowance. Illustrative example: a pasta dish costs €3.50 and your target is 30%. So €3.50 ÷ 0.30 = €11.67. Round it to a menu-friendly €11.50 or €11.90. Then check it against the prices of nearby competitors.
The 3x rule multiplies ingredient cost by three to set the price, which is a 200% markup. That gives a food cost of about 33%. Illustrative example: a dish costs €4.00, so it sells for €12.00. Check it: €4.00 ÷ €12.00 = 33.3%. It is a quick check. But a flat markup ignores labour-heavy dishes and local demand.
Many operators drop it. In a Cornell and Culinary Institute of America study of 201 diners, guests given menus without currency symbols spent about 8% more. They were compared with guests whose menus showed dollar signs. Pair the change with clean, consistent numbers that suit the style of your venue.
Tie price changes to cost data, not to the calendar. A good habit is to review plate costs whenever a key supplier raises prices. Run a full check several times a year. Regulars usually accept small, well-timed adjustments better than one large jump. And with digital menus, you can update prices without any reprinting.
Often not, but it depends on national law. Article 6a of Directive 98/6/EC, added by Directive 2019/2161, says announced price reductions must quote the lowest price of at least the previous 30 days. According to European Commission guidance, the rule is written for goods, so a restaurant happy hour will often fall outside it. Check your local rules, and never show an inflated “was” price.
Sources: Eurostat — Consumer prices: inflation (HICP), Statistics Explained · Escoffier — How to Price a Menu to Improve Profitability for Your Restaurant · Cornell Chronicle — Beware of menus that don’t use dollar signs · Wikipedia — Menu engineering · European Commission — Price Indication Directive (98/6/EC) · EUR-Lex — Commission guidance on Article 6a of Directive 98/6/EC (2021/C 526/02) · EUR-Lex — Directive 2005/29/EC on unfair commercial practices · Baker McKenzie Global Litigation News — CJEU confirms that a price reduction must be calculated based on the lowest price in the last 30 days · European Commission — Mandatory food information (Regulation (EU) 1169/2011) · CSA Research — Survey of 8,709 consumers in 29 countries finds that 76% prefer purchasing products with information in their own language · UN Tourism — World Tourism Barometer, January 2026